Background 

The United Nation’s International Day of Happiness is today.[1]. As part of the day’s activities the UN is also releasing the newest edition of the World Happiness report. Coupled with that, ISEP’s Social Sustainability Steering Group has recently issued its “Social Sustainability 101” document [2].   

So why would sustainability professionals want to talk about happiness? Firstly, one of the key components of sustainable development is human wellbeing and people are an integral part of the other two pillars of sustainability: economy and environment. The UN’s Sustainable Development Goals are a key measure of our progress as humans and a thriving environment and equitable economic system enable people to prosper, now and in the future.

image

According to research from the University of Oxford [3] sustainable development makes people happier, However the research also explored how the different aspects balance and found that efforts to reduce emissions and consumption must be coupled with ambitious social policy to transition in a fair and just way without punishing people at the bottom of income distribution scales. It is therefore paramount that our efforts to reduce our impact on the environment are carefully considered with social sustainability in mind. 

As awareness of social sustainability increases, the steering group thought it would be a good idea to relay statistics on the wellbeing of the UK population.  The hope is that these statistics will prompt industry, government and other organisations to consider their impact on wellbeing and make greater strides in their social sustainability work. 

UK statistics 

The UK’s Office of National Statistics (ONS) issues regular wellbeing statistics via its Wellbeing Dashboard.  The latest data is for July 2024-September 2024 [4] and covers a range of wellbeing issues, including respondents’ self-reported life satisfaction.  ONS surveyors asked 20,160 people in the UK, "Overall, how satisfied are you with your life nowadays? Where 0 is 'not at all satisfied' and 10 is 'completely satisfied'". 

The average answer was 7.7 out of 10.  On the face of it, this seems quite good (see international comparison below), but there is still room for improvement. Of course, averages hide a lot of detail and the data release does allow a bit of interrogation. 

The average % of people reporting either 9 or 10 out of 10 was only 28.3% and those with very low satisfaction was 5%. 

There were noticeable differences between age groups:

There are no major differences between males and females but the data does reveal regional differences:

The ONS release makes no attempt to explain differences or offer potential solutions.  This may be a topic of further exploration. 

International comparison 

Comparing statistics with other nations may offer insights to see if something better is even possible.  The World Happiness Report [5] is an excellent data source. Based on the latest release from 2024 other nations do have happier people than in the UK, with 19 other nations scoring higher. There are slight differences in statistics: 

  • A time lag 
  • Only 1,000 people asked via Gallup World Poll 
  • The question was slightly different [6] 

Here is an excerpt from the latest report:

A screenshot of a computer

AI-generated content may be incorrect.

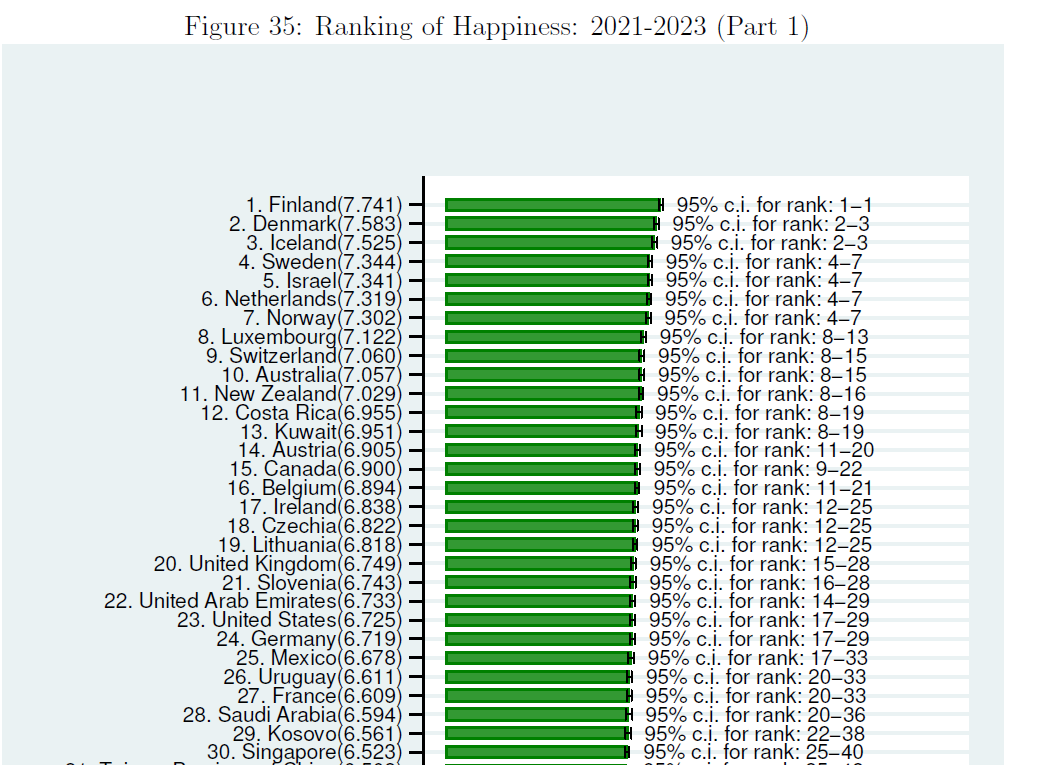
It is quite well known that Scandinavian countries tend to score highly on wellbeing  and that is reflected in this dataset.  Given the events in the Middle East it may be surprising to see Israel so high up in the chart, but this maybe due to the time lag.  This report does attempt to explain differences via various regression analyses.  At a country level, factors analysed include: 

  • GDP per capita 
  • Social support 
  • Healthy life expectancy at birth 
  • Freedom to make life choices 
  • Generosity  
  • Perceptions of corruption 

What next? 

We would very much welcome your feedback on how useful you think these datasets are, and particularly if you would like to see them reported on a regular basis through our Social Sustainability Newsletter. 

Also, ISEP’s Social Sustainability Steering Group is compiling a list of policy asks to improve social sustainability in the UK.  And maybe any successes will be reflected in future ONS data releases. 

In the meantime, organisations and individuals can take actions now: 

  • Governmental level – consider, at policy level, the factors highlighted in the World Happiness Report and implement actions to make improvements. 
  • Organisational level – download ISEP’s 101 on social sustainability and use as inspiration for improving the wellbeing of staff and people in your supply chain. 
  • Individual level – the World Happiness Report does have various regressions for individual factors.  In addition, the UK’s NHS has a “five-a-day” guide for individual wellbeing which is very easy to implement [7] 

The Social Sustainabiluty 101 guide and be found here.

To sign up to our Social Sustainability Network newsletter update your preferences at My ISEP portal profile. 


[1] https://www.un.org/en/observances/happiness-day 

[2] https://www.iema.net/policy-and-practice/social-sustainability/practical-guidance/ 

[3] Sustainability makes people happier, research finds | The World Happiness Report 

[4] https://www.ons.gov.uk/peoplepopulationandcommunity/wellbeing/datasets/quarterlypersonalwellbeingestimatesnonseasonallyadjusted 

[5] https://worldhappiness.report/ 

[6] The question was, “Please imagine a ladder, with steps numbered from 0 at the bottom to 10 at the top. The top of the ladder represents the best possible life for you and the bottom of the ladder represents the worst possible life for you. On which step of the ladder would you say you personally feel you stand at this time?” 

[7] https://www.nhs.uk/mental-health/self-help/guides-tools-and-activities/five-steps-to-mental-wellbeing/ 


Published by:
image

Richard Lupo

FISEP, Chair of Social Sustainability Steering Group, Managing Director of SHIFT Environment